The FP&A team at Stage 1 dug into the marketing spend vs. revenue pre, during, and post-COVID splitting the analysis between small, medium, and large companies while also taking into account different industries. Here is what we found:
Company Size:
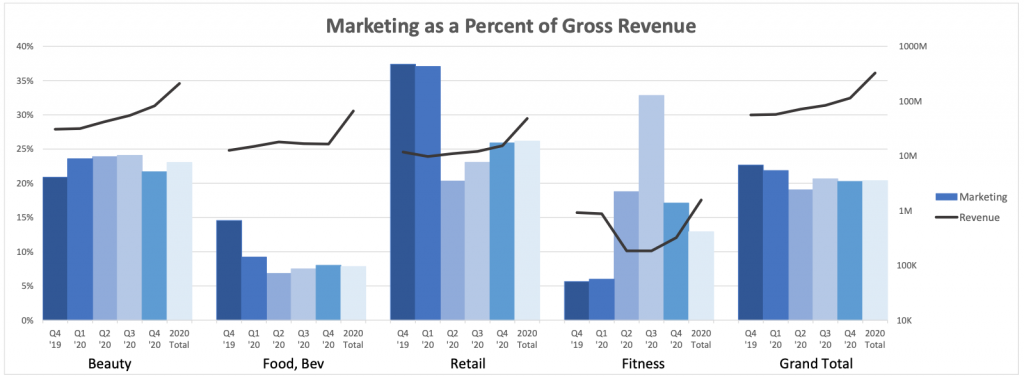
By Industry:
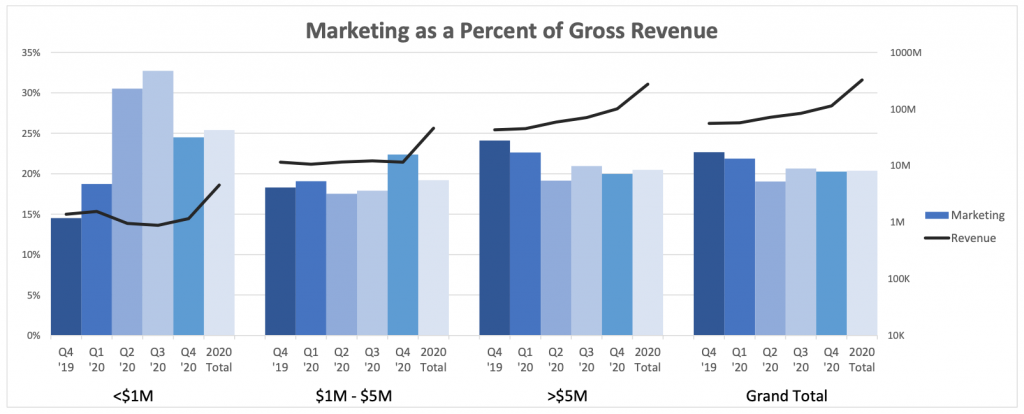
Graph 1: (Company Size)
- Smaller companies (less than $1M run rate in revenue) saw the biggest impacts. Their spend dollars actually increased (even more significantly as a % of revenue) while their revenue was slightly declining in Q2 and Q3 and did not recover until Q4.
- Medium-sized companies (between $1M & $5M Run Rate in Revenue) were pretty flat in spending both as a % of revenue and in total $$$ with little to no impact to revenue until Q4.
- Larger-sized companies (greater than $5M in run rate in revenue) continued to spend at pre-COVID rates in both % and $$$ and revenue continued to increase throughout COVID and post-COVID.
Graph 2: (By Industry)
- To no surprise, Fitness declined heavily during COVID while spending from a total $$$ perspective did not decline at the same rate.
- Beauty powered through COVID and exited with strong growth as they continued to spend and increased their DTC performance.
- Food & beverage and retails held steady in both spend and revenue growth (flat to slight increases) during COVID and exited with strong Q4’s. DTC sales during COVID offset revenue declines in physical locations for both industries.